
Data analysis often involves exploring data to unearth insights, then crafting stories to communicate those findings. But converting discoveries into coherent narratives poses challenges. Researchers have developed an AI assistant called Notable that streamlines data storytelling within notebooks like Jupyter.
Notable offers real-time suggestions as users analyze data, recommending interesting patterns to highlight. It also auto-generates presentation slides to share analyses. Early studies found Notable reduced busywork and helped workers create more focused stories.
Data workers frequently switch between tools to go from data to deck. Specialized programs like Tableau let them visualize data; tools like PowerPoint assist slide layouts. But significant manual effort is required to transfer content between activities.
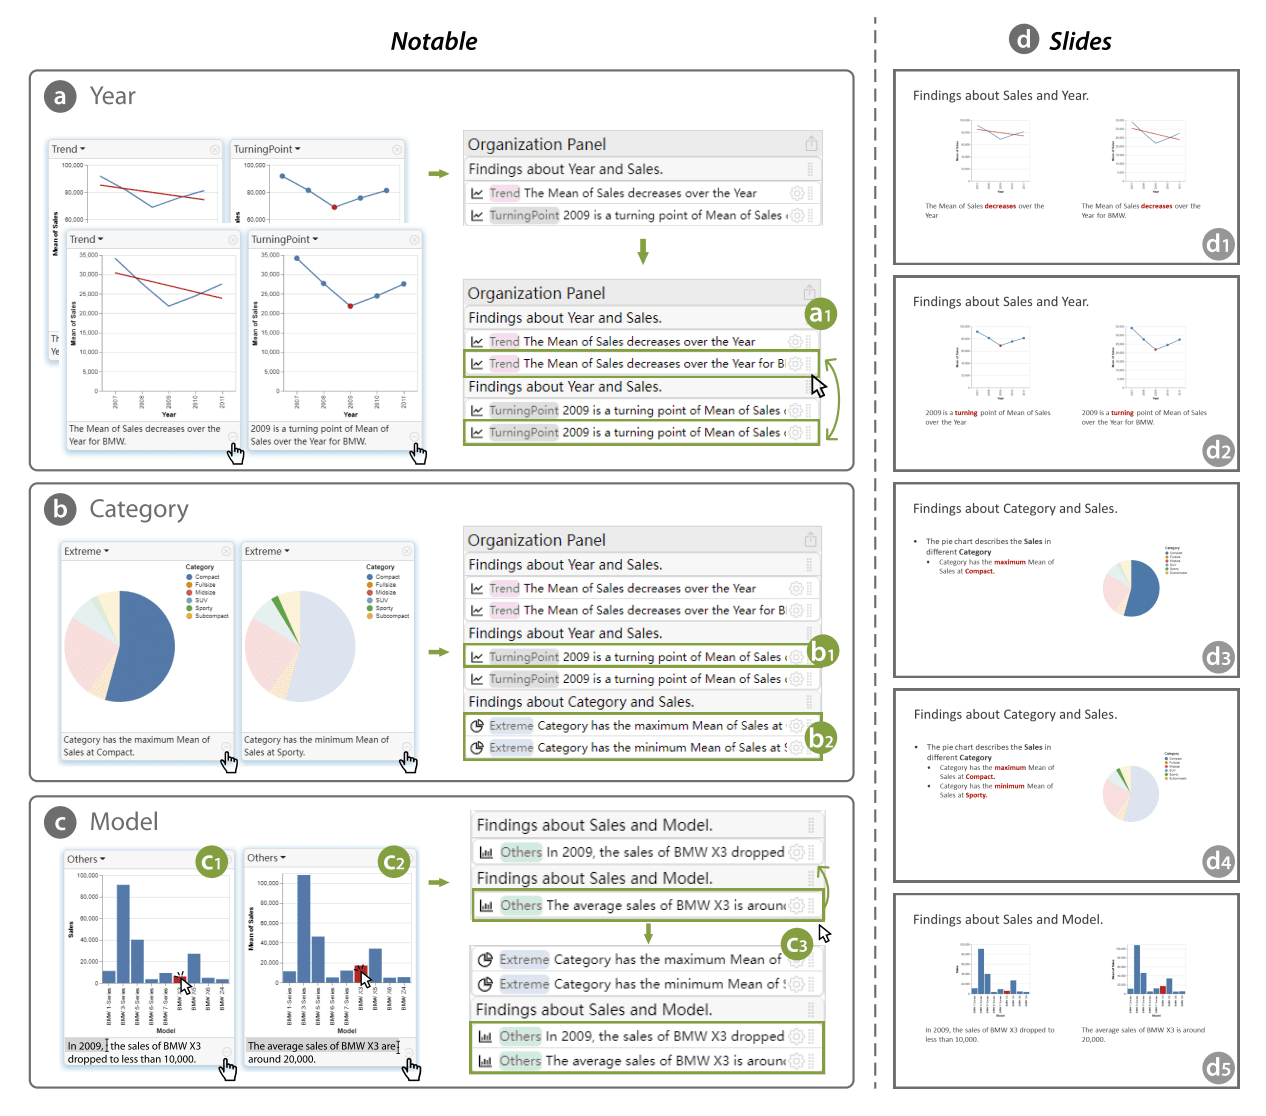
Notable tightly integrates data exploration and presentation within notebooks. As users create charts, it flags noteworthy trends like dramatic shifts over time. These highlighted "data facts" can be added to Notable's storyboard with one click. It also automatically organizes selected facts into logical slides.
For instance, say a user graphs car sales by year. Notable may flag a sales plummet in 2009 as a key turning point. By clicking to add this insight to their storyboard, it gets translated into a polished slide highlighting the 2009 decline.
This quick, context-aware assistance reduces tedious toil. No more manually describing each chart to record findings or painstakingly laying out presentation slides. Notable handles these mundane tasks while users focus on analysis.
To suggest data facts, Notable utilizes simple heuristics. For time series data, it flags years with sharp increases or decreases. For categories, it identifies those with minimum and maximum values. Users customize suggestions or add their own insights.
For organization, Notable applies optimization algorithms to order facts in a coherent sequence. Related facts get grouped into common slides. The storyboard enables reordering slides with drag-and-drop.
Once ready to export their story, one click produces a shareable slide deck. Notable handles translating charts and descriptions into professional slides. Users can still refine layouts in PowerPoint.
Researchers evaluated Notable with 12 data workers across industries. All succeeded in using it to explore a movie dataset and build presentation decks. Questionnaires showed strong satisfaction with Notable's usefulness and usability.
The automated data facts provided helpful analysis shortcuts for many users. Some viewed Notable's storyboard as an overview facilitating deeper data dives. The generated slides were seen as high quality starting points.
However, Notable has limitations to address. Its simple heuristics for flagging insights occasionally missed more complex patterns users wanted highlighted. And while most liked the presentation format, offering personalization could suit more preferences.
Some users wanted tighter integration between Notable's exploration and storytelling. For instance, highlighting relationships between facts, or recommending additional analyses to support key findings. Such smart guidance could make Notable even more powerful.
Overall though, easing the painpoints of transferring analysis into narratives and polished slides proved valuable. Notable demonstrates how AI can make data storytelling less tedious for overburdened workers.
The researchers plan to support more visualization types, personalized slide layouts, and smarter recommendations in Notable. Long-term case studies can reveal how it performs for impactful real-world analysis.
As data permeates business and society, conveying insights through compelling stories grows more crucial. Tools like Notable that streamline crafting narratives from data patterns promise to make such communication more effective, accessible, and ubiquitous. The fruits of data analysis need no longer languish in siloed projects when smart assistants can help translators swiftly spin gold from the rough ore of insights.
Sources:

